Dynatrace app for iPhone and iPad
Developer: Dynatrace LLC
First release : 13 Aug 2014
App size: 25.08 Mb
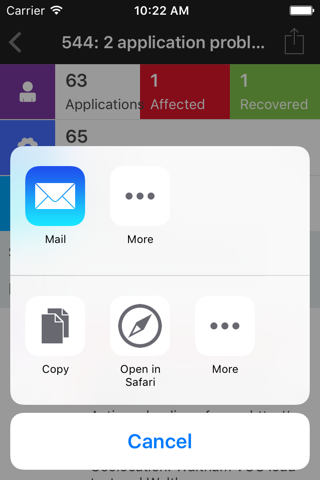
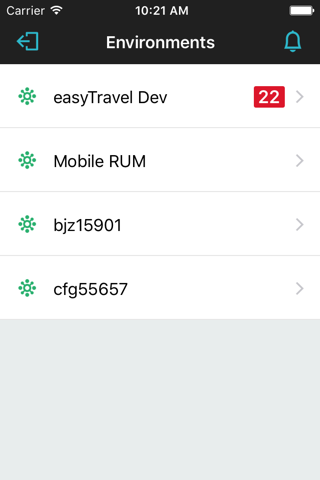
The Dynatrace mobile app provides real-time alerts on your iPhone/iPad when performance problems are detected in your application environment. As a key component of the Dynatrace application performance monitoring system, the Dynatrace mobile app provides real-time root-cause analysis—from your cloud-based infrastructure all the way down to individual lines of application code—that your developers can use to accelerate problem resolution.
All-in-one performance monitoring with artificial intelligence
Dynatrace is a full-stack performance and availability monitoring system that enables your DevOps team to monitor the health of your entire application environment, from the cloud-based datacenter level, to the services that your applications rely on, all the way down to the code-level, Dynatrace monitors it all. With real user monitoring, Dynatrace even provides real-time performance insights into your customers’ mobile and desktop experiences with your application.
Dynatrace uses artificial intelligence to significantly reduce the time required to identify the root causes of system performance problems. Rather than overload you with ambiguous alerts, Dynatrace provides you with complete, pre-analyzed problems that show you both the full impact and the cause of each detected problem.
Artificial intelligence enables Dynatrace to learn the baseline performance of every component in your environment and thereby instantly detect performance problems and their causes. Dynatrace continuously monitors the health of your hosts and network, cloud-based services, hypervisors (including VMware ESXi and Amazon Web Services), and service infrastructure to keep you and your team in control of the health of your application environment.
Keywords
- Monitoring
- Application performance management (APM)
- Server monitoring
- Real user monitoring (RUM)
- Apdex
- Virtualization monitoring
- Correlation metrics
- Operating system metrics
- Network metrics
- Real user experience metrics
- Synthetic-user monitoring (SUM)
- Production environment monitoring
- Full monitoring of technology stacks
- Hypervisor monitoring (VMWare ESX, Amazon AWS)
- Database monitoring
Dynatrace appreciates your feedback - feel free to tell us what you think or how we can improve Dynatrace: [email protected]


